 |
 |
| SiO2 | MgB2 |
4.6 GEMSQRAW: Quick Plotting of GEM Data
 |
 |
| SiO2 | MgB2 |
OpenGenie Software
Software for quick visualisation of GEM data is available within the OpenGenie program. This can be run identically on a VMS computer or a Windows PC (although the data will need to be transferred to the PC first). Click here to find out how to start OpenGenie. If you run OpenGenie on the GEM VMS computer or the PC in the GEM cabin then the programs described below will automatically be set up.
In all of these programs, typing abort in response to any question will cause the program to stop immediately. If you press carriage return in response to a question then the default will be selected. If you are unsure what response to give then you should select the default. If for any reason you wish to reload the software into OpenGenie then this may be done by typing gemproc. If any errors occur when the software is loaded into OpenGenie then they will be recorded in the file gemsqraw_errors.dat.
Click here to find out how to print your OpenGenie plots.
Click here for information on installing this software on a PC.
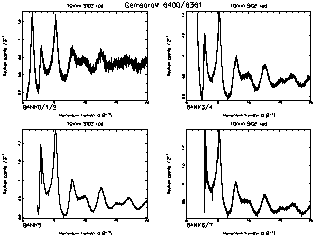
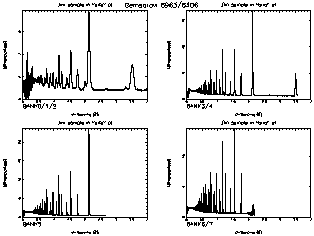
The purpose of this program is to produce a quick visualisation of the data. The program calculates a focussed and normalised (sample/vanadium) spectrum for each existing detector bank. If desired, suitable backgrounds can be subtracted from the sample data and/or the vanadium data. The program is able to read data for a run which is still in progress, without any need to update or save the run. Vanadium data which have been smoothed by use of the ATLAS suite may be used by the program. This has the advantages that the result is obtained more quickly and has a better appearance, due to the removal of vanadium Bragg peaks. The smoothed vanadium data must be stored in the vansm subdirectory. The x-axis of the output can be either d-spacing, d, or momentum transfer, Q. Click here for a plot of typical glass data, or here for a plot of typical crystal powder data. The focussed data can be saved to a file named like GEM06914.SQR.
After execution, the focussed and normalised data are stored in a WorkspaceArray called bank. Each element of bank corresponds to a GEM detector bank - for example you can make a plot of the data for bank 5 by typing d bank[5] 0 10 (this will plot the data over the x-axis range from 0 to 10). The WorkspaceArray bank may be copied to another WorkspaceArray (called sio2 for example) by typing sio2=bank. (At the time of writing, GEM's bank zero does not exist, but when it becomes available its data will be stored in bank[8].)
GEMSQRAW normalises the data for each run to the number of microAmp-hours. As well as being able to read .RAW data files, GEMSQRAW is also able to read .SUM files produced by the NORM program of the ATLAS suite.
The purpose of this program is to produce a quick visualisation of the data. The program calculates a focussed spectrum for each existing detector bank. For example the data for run 7422 may be focussed and stored in a WorkspaceArray called scan by typing scan=gemfocus(7422). The data are normalised only to the incident beam monitor spectrum, with the advantage that GEMFOCUS is quicker than GEMSQRAW. However, the data are not normalised to vanadium data and backgrounds cannot be subtracted.
The purpose of this program is to produce a standard plot of focussed GEM data. Click here for a plot of typical glass data, or here for a plot of typical crystal powder data. The focussed data must already be stored in an OpenGenie WorkspaceArray, as a result of running GEMSQRAW, GEMFOCUS or READFILE. To use the program type gemplot scan where scan is the name of the WorkspaceArray which you wish to plot. If you wish, you can change the title on the plot, for example by typing gemplot scan title="New title". The full list of parameters that can be added to the GEMPLOT command line is as follows...
| bank=scan | Name of WorkspaceArray to be plotted |
| title="New plot" | Plot title |
| xmin=1.0 | Global minimum value of x for the plots |
| xmax=10.0 | Global maxmimum value of x for the plots |
| ymin=0.0 | Global minimum value of y for the plots |
| ymin=2.0 | Global maxmimum value of y for the plots |
| (Example values are given for each parameter.) | |
The purpose of this program is to read in a set of data which has already been focussed and saved by GEMSQRAW (or by the WRITEFILE program). To use this program type abc=readfile() where abc is the chosen name of the WorkspaceArray to which the data will be read. You will then be prompted for the run number. If you wish you can specify the sample run number in the command line by typing data=readfile(216) or ccl4=readfile(nrun=6914) for example. By default a file extension of .SQR is assumed, but this can be changed by using the parameter ext: for example by typing a=readfile(7604,ext="sum") . In this way ATLAS files or GUDRUN files may be read into OpenGenie.
The purpose of this program is to save a GEM WorkspaceArray to a file. To use this program type writefile data where data is the WorkspaceArray to be saved (this may have been produced by the programs GEMSQRAW, READFILE or GEMFOCUS). The files created by WRITEFILE may be read back into OpenGenie by use of the READFILE command. By default the file created will be an OpenGenie intermediate binary file with extension .SQR . A file with a different extension can be created by using the parameter ext . The parameter filetype may be set to g2, g3 or ascii, in order to create either a Genie v2 intermediate binary file, an OpenGenie intermediate binary file or an ascii file of the same format as used by the GUDRUN programs. Here are some examples showing how to use the writefile program:
writefile bank ext="soq"
filetype="g2"
writefile sio2 filetype="ascii" ext="dat"
writefile data filetype="g3"
Units Conversion
Focussed GEM data in a WorkspaceArray called bank for example, may be converted from Q to d (or vice versa) by typing bank_d=q2d(bank) (or QQ=d2q(bank) ).
Utility Programs
| wordfig | Save the last plot in a file gemsqraw.cgm suitable for inclusion in a Word document. |
| las | Save the last plot in a postscript file genie.ps
and send it to the laser printer - if you give a laser printer number as a parameter (e.g. type LAS 2) then this will be used to determine which printer to use, otherwise the plot will be sent to the printer in the GEM cabin. |
| nspec() | Gives the number of spectra for the specified run e.g. type printn nspec(5462). |
| head() | Gives the header for the specified run e.g. type printn head(7422). |
| uamp() | Gives the number of microAmp-hours for the specified run e.g. type printn uamp(220). |
| readsum() | Read an ATLAS file (a .SUM file by default) into an OpenGenie WorkspaceArray e.g. type vdata=readsum(1170,"SMO") |
| wd | Display all elements of a WorkspaceArray on a single frame graph. e.g. type wd bank. |
| wp | Overplot all elements of a WorkspaceArray on a graph produced by wd. e.g. type wp sio2. |
Last updated on 18 Jul 2002 by Alex Hannon (a.c.hannon@rl.ac.uk)