| 11. List of Figures |
![]()
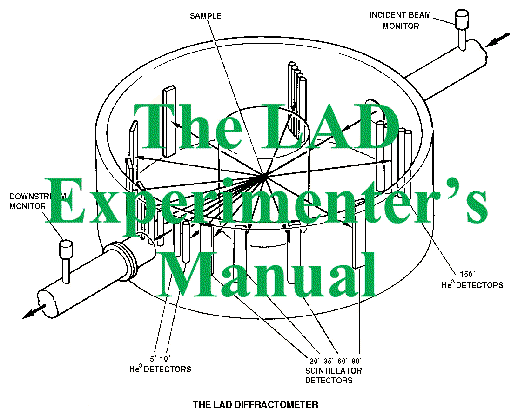
| Figure 1 | The LAD Diffractometer (RAL negative number 92MB2786). |
| Figure 2 | The distinct scattering i(Q) for GeO2 glass. |
| Figure 3 | The total correlation function T(r) for GeO2 glass. |
| Figure 4 | Typical results from the AUTO / PLAUTO programs, showing data for liquid lead at 350°C. |
| Figure 5 | A typical plot from the dynamic temperature plotting program REALITY, showing the change with time of two thermocouples in a furnace. |
| Figure 6 | Comparing the Bragg peaks calculated by the program BRAGG with LAD data. |
| Figure 7 | An AUTO plot for a phosphate glass containing a significant amount of hydrogen. |
| Figure 8 | The wavelength-dependent cross-section per molecule for H2O [6]. |
![]()


![]()
Last Updated 15 Aug 2007