| 4.4 Inspecting the Data |
![]()
During the experiment it is important to use GENIE [4] to regularly inspect the data so that problems can be identified and remedied before it is too late. These problems can include difficulties with the sample, detector failures and moderator malfunctions. The following commands are available within GENIE for inspecting the data:
Command Description NQ Normalise the data to the incident beam monitor for one angle, both sides, with the result versus Q ND Normalise the data to the incident beam monitor for one angle, both sides, with the result versus d-spacing ND2 Does the same as ND, except that it uses detectors on only side of the instrument NQ2 Does the same as NQ, except that it uses detectors on only side of the instrument NL Normalise the data to the incident beam monitor for one angle, both sides, with the result versus wavelength NT Normalise the data to the incident beam monitor for one angle, both sides, with the result versus time-of-flight SQRAW Normalise the data for one angle to vanadium data, both sides. PLAUTO Read and plot the results from AUTO SQSIDE Does the same as SQRAW, either for the 90° left detectors or for the 90° right detectors TQRAW Does the same as SQRAW except that data are normalised to transmission monitor so as to perform a first approximation to the attenuation correction SQANG Calculate S(Q) from .NRM file data BEAM Plot the beam log (see section 4.6) NPOLD Plot a previous day's neutron/proton ratio (see section 4.6) NPNEW Plot today's neutron/proton ratio (see section 4.6) TCUR n Load a temperature log for the current run into Wn TOLD m nnnn Load a temperature log for run nnnn into Wm K/H This GENIE command (KEEP/HARDCOPY) will save the last plot into a plot file (named DEC_POSTSCRIPT.DAT) LAS3 Following K/H this will send a hardcopy plot to the laserprinter in the LAD cabin TOF Produce a powder profile1 suitable for profile refinement. Once TOF has been run successfully the profile (in workspace W27 for example) may be saved as a .DAT file by TR W27 G_F:PROLSFILE W27 TOF2 Does the same as TOF, except that it uses detectors on only side of the instrument Table 6 GENIE Commands for Inspecting the Data
It is recommended that for a first examination of the data one uses the program NQ to look at data from the backward angle detectors (150°, angle number 7) since these detectors have a high count rate and this program is relatively quick. However, the program NQ produces an output whose appearance is rather different to that of the structure factor S(Q) as a consequence of its simple normalisation to the incident monitor spectrum (this introduces the ratio of monitor and detector efficiency functions as an additional factor). The program SQRAW is slower to run, but it produces an output whose appearance is more similar to that expected for the structure factor. A choice is offered by SQRAW of using either a raw vanadium data file (.RAW) or a vanadium data file which has been smoothed using the ATLAS [2] vanadium smoothing routine (.SMO) - obviously the user should not select the smoothed data option unless they have previously run the smoothing routine.
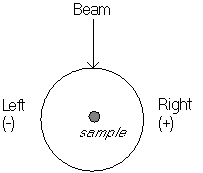
The two sides of the LAD detector system are named Left and Right according to a convention whereby the instrument is viewed facing towards the source. There is also a convention in the data analysis in which the angles for the left hand side are given as negative whilst those on the right are positive.
LAD Detector angle conventions (view of LAD from above)
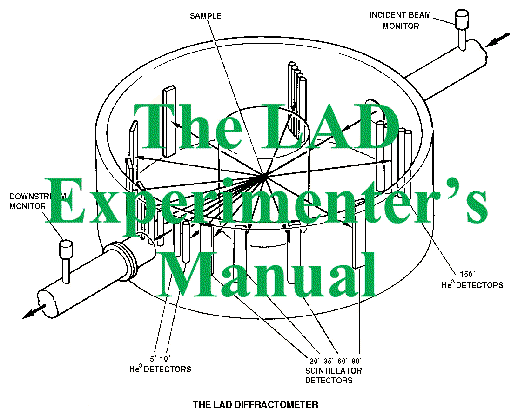
Angle Group Spectrum numbers Detectors 1 1 S12 5° gas Left 2 S11 5° gas Right 2 3 S10 10° gas Left 4 S9 10° gas Right 3 5 S42>S49 20° scintillator Left 6 S50>S57 20° scintillator Right 4 7 S33>S41 35° scintillator Left 8 S58>S66 35° scintillator Right 5 9 S24>S32 60° scintillator Left 10 S67>S75 60° scintillator Right 6 11 S15>S23 90° scintillator Left 12 S76>S84 90° scintillator Right 7 13 S1>S4 150° gas Left 14 S5>S8+S85>S88 150° gas Right Table 7 LAD Detector Groupings
(S42>S49 means spectrum numbers 42 to 49)
It can be quite time-consuming to run the program SQRAW repeatedly for each of the seven different detector angles, and hence an automated method of doing this has been set up. This is run by typing AUTO and then giving the sample and vanadium run numbers. A batch job is initiated which creates a file [LAD.SQRAW]LAD01234.SQRAW for example. When the batch job has completed the results may be plotted in GENIE by use of the command PLAUTO and Figure 4 shows typical results. The .SQRAW files created by the AUTO program will eventually be deleted from the computer in order to save disc space.
1 A detailed discussion of profile refinement is beyond the scope of this manual. However, other programs have been set up by the ISIS Crystallography Group for dealing with the profile refinement of LAD data, and further information can be obtained from a member of this group.
![]()


![]()
Last Updated 09 Nov 1998